
Showing posts with label Sun. Show all posts
Showing posts with label Sun. Show all posts
Saturday, August 31, 2013
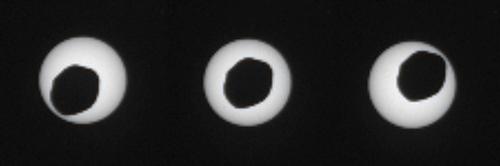
An Annular Eclipse of the Sun...
Down on the surface of Mars, the Curiosity rover looked up to see a beautiful annular eclipse of the sun by the Martian moon Phobos. You can easily see that Phobos is not spherical – it's shaped more like a potato than a ball...

Thursday, April 25, 2013
Wednesday, April 10, 2013
Looks Like We've Passed the Sunspot Peak...
It looks like we've passed the sunspot number peak for this cycle, and it was a lot lower than even the revised NOAA forecast:

Fewer sunspots means lower solar irradiance, something that (according to observational history, but not climate models) is closely correlated with colder climate. We've had a colder-than-usual winter. It will be interesting to see what our weather is like for the next 5 or 6 years, as this cycle progresses...
Fewer sunspots means lower solar irradiance, something that (according to observational history, but not climate models) is closely correlated with colder climate. We've had a colder-than-usual winter. It will be interesting to see what our weather is like for the next 5 or 6 years, as this cycle progresses...
Tuesday, February 26, 2013
Coronal Rain on the Sun...
The Solar Dynamics Observatory captured the photos used to make this movie last summer. When you play the video below, you're seeing things about 360 times faster than they actually occurred – ten hours of actual events seen in about four minutes. Via APOD, of course...
Saturday, February 9, 2013
Oops: Sunspot Count Lower than Projected - Unexpectedly!
If you've been tracking the debate on the sun's influence on climate, then you know that (somewhat counter-intuitively) the sun's luminosity (energy output) increases when there are more sunspots (see here for an explanation). For years, climate scientists left solar luminosity variation out of their models, and denied that it had any significant effect on weather or climate. Skeptics of anthropogenic global warming (AGW) have long been pointing to the high sunspot counts (and therefore high solar luminosity) of the last solar cycle as a likely cause of the global warming observed in the '90s and early '00s. Over the past couple of years, even the mainstream climate scientists are changing their position on this, as more and more observational evidence comes in that the skeptics were right.
Meanwhile, over at NOAA they've been trying to predict what the current solar cycle's sunspot count will be, and they keep getting surprised – by how low the count is (see chart below, sourced here). At the same time, all observational evidence of continued global warming has come to a halt – temperatures have been flat for over five years now. AGW skeptics point to this as evidence that the solar luminosity is causing global warming, but really all they have so far is a good correlation; causation has yet to be established. But...some mainstream climate scientists are now pursuing observations aimed to establishing that causation (see, for example, the recent observations showing that solar luminosity variation in the ultraviolet spectrum is far higher than it is in optical – and the energy output of the sun is much higher in that spectral region than it is in the optical region).

Meanwhile, over at NOAA they've been trying to predict what the current solar cycle's sunspot count will be, and they keep getting surprised – by how low the count is (see chart below, sourced here). At the same time, all observational evidence of continued global warming has come to a halt – temperatures have been flat for over five years now. AGW skeptics point to this as evidence that the solar luminosity is causing global warming, but really all they have so far is a good correlation; causation has yet to be established. But...some mainstream climate scientists are now pursuing observations aimed to establishing that causation (see, for example, the recent observations showing that solar luminosity variation in the ultraviolet spectrum is far higher than it is in optical – and the energy output of the sun is much higher in that spectral region than it is in the optical region).
Monday, January 21, 2013
Who Lopped the End Off My Graph?
You'd expect a solar intensity graph, taken over the course of a day, to show half a cycle of something approximating a sine wave. Solar luminosity at any given moment is mainly proportional to the cosine of the sun's elevation in the sky. There's a little extra attenuation when the sun is at lower elevations, as there's more air for it to travel through – and if the air is dirty, much light will be absorbed by the dust and other particulates. Out here, though, the air is really clear. So why does today's solar intensity graph look like this?

From about 9 am to 4 pm, the graph looks like what we'd expect.
Before 9 am, it's just chopped off. The reason is straightforward: before 9 am, from the vantage point of the weather station the sun is blocked by Gaskill Peak (one of the mountains forming Lawson Valley's eastern rim). At 9 am the sun rose over Gaskill Peak, and the intensity jumped to right where you'd expect it.
After about 3:45 pm, the graph gets all squiggly. That's happening because at that time the sun is approaching the horizon (again, from the weather station's perspective), which right there is formed by some chaparral brush. You're seeing the light from the sun being attenuated by highly variable shadows of the chaparral's leaves and branches – perhaps even being moved around by the wind.
To get a really pretty graph, we'd need to have the weather station up on top of a local peak, with clear views to the horizon where the sun sets and rises (of course this would change throughout the year).
We only had seven and a half hours of bright sunlight today...
From about 9 am to 4 pm, the graph looks like what we'd expect.
Before 9 am, it's just chopped off. The reason is straightforward: before 9 am, from the vantage point of the weather station the sun is blocked by Gaskill Peak (one of the mountains forming Lawson Valley's eastern rim). At 9 am the sun rose over Gaskill Peak, and the intensity jumped to right where you'd expect it.
After about 3:45 pm, the graph gets all squiggly. That's happening because at that time the sun is approaching the horizon (again, from the weather station's perspective), which right there is formed by some chaparral brush. You're seeing the light from the sun being attenuated by highly variable shadows of the chaparral's leaves and branches – perhaps even being moved around by the wind.
To get a really pretty graph, we'd need to have the weather station up on top of a local peak, with clear views to the horizon where the sun sets and rises (of course this would change throughout the year).
We only had seven and a half hours of bright sunlight today...
Tuesday, January 15, 2013
Solar Ballet...
This flare (from 12/31/2012) is gigantic: the entire Earth would easily fit within it. Via APOD, of course:
Tuesday, January 8, 2013
Oops: Sun Spot Count Unexpectedly Low – Again......

So it is of great interest to AGW skeptics to note that the more recent lack of a warming trend in Earth's atmospheric temperature correlates rather well with a lack of sunspots – the sunspot counts are coming in consistently well below the predictions by the solar scientists' models. Besides providing yet another really nice example of models gone horribly wrong, this also provides more support for the skeptic's hypothesis that the primary driver of “global warming” isn't greenhouse gases at all, but rather solar luminance.
The latest solar luminance numbers from NASA are plotted at right, with the dots being the actual data and the blue curve the smoothed equivalent. The green curves are the predictions (from 2007) of the two main families of solar luminance models, each with their cadre of solar science supporters (there were also a few solar scientists who thought both models were bunk). The red curve is a revised model, published in 2009 at which point it was quite clear that both original models were way off. The 2009 model isn't faring much better.
Robert Zimmerman, who collected and published this data, says:
Meanwhile, on January 2 the solar scientists at the Marshall Space Flight Center once again lowered their prediction for the upcoming solar maximum, dropping their predicted peak sunspot number from 72 to 69. This is the fifth month in a row that they have changed their prediction, and the fourth in a row in which they have dropped it. Considering that we are now only a few months from when they say maximum should occur, their constant revision of their prediction suggests they really haven’t the faintest idea what causes the solar cycle, and are merely guessing at what they think will happen.I agree. They haven't a clue. I wish they would just admit the mystery and get to work solving it!
Monday, September 17, 2012

Monday, August 20, 2012
“Clouds” on the Sun...

Monday, June 11, 2012
Transit of Venus...
A nice video compilation of observations of the recent transit of Venus, made by various scientific instruments operated by NASA. More than anything I've seen recently, this video brings home just how much our solar observing capabilities have improved in just the past few years. Most of the differences in the various views you'll see have to do with what wavelengths of light are being observed. From APOD, of course – and when you click over there, don't miss the links to other photos of the transit. Some of them are amazing!
Saturday, June 9, 2012
Venus on the Edge...

This image shows Venus just as it crossed one edge of the sun. If you click on the photo to enlarge it, you can clearly see a bright ring all the way around Venus – sunlight refracting through Venus' carbon dioxide rich atmosphere.
Photo from APOD, of course...
Sunday, June 3, 2012
The Transit of Venus...

With the right equipment (inexpensive and easy to obtain) and some care, you can safely see this yourself. Or you can watch it online, in real time.
More information about the transit and how to watch it yourself, here, here, and here...
Thursday, May 3, 2012
Transit of Venus...
Just a month from now (June 5 or 6, depending on where you are), the planet Venus will move across the face of the sun (as seen from Earth). Astronomers call these events “transits”. This is the last transit of Venus over the sun for over 100 years, so if you want to see one, this would be the time to do it. More information here and here.
Wednesday, April 18, 2012
Portraits of Our Sun...

Tuesday, April 17, 2012
Explosion on the Sun...
 |
| Solar Explosion |
Tuesday, November 15, 2011

Wednesday, September 28, 2011
Giant Solar Flare...

Sunday, September 18, 2011
The Sun...

Via APOD, of course...
Thursday, June 16, 2011
Is a New Ice Age on the Way?
Short answer: nobody really knows.
The news of some scientists predicting the possibility of a new “little Ice Age” broke a few days ago. I didn't post anything right away, as I wanted to read up on both the original story and reactions to it. Here's my summary, after reading a lot of articles:
The news of some scientists predicting the possibility of a new “little Ice Age” broke a few days ago. I didn't post anything right away, as I wanted to read up on both the original story and reactions to it. Here's my summary, after reading a lot of articles:
- All the report really says is that what's being observed today looks an awful lot like what little we know about the beginning of the Maunder Minimum.
- The authors of the report then speculate about the possibility that this indicates we're about to enter such a period.
- It would take several years of consistently low sunspot counts before we could really say with any certainty that this was happening.
- The pro-AGW crowd is quite predictably reacting negatively to this potential destruction of their world view. I'd expect nothing else. But just because they're predictable doesn't mean they're wrong.
Subscribe to:
Posts (Atom)