
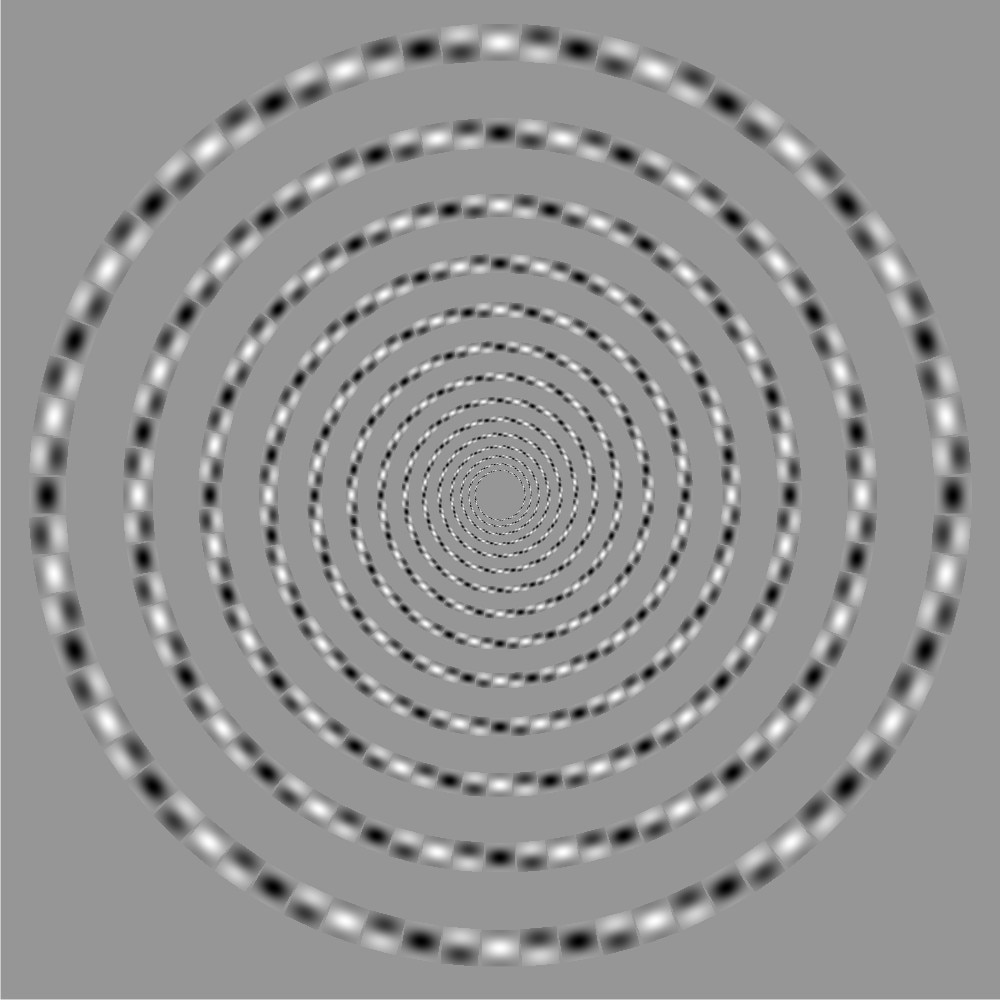
Excellent little article here explaining the phenomenon.
Sometime back in the Paleozoic Era (circa 1979), I built a device to help a scientist measure spatial resolution in people, at various contrast ratios. The display of this device was a bunch of vertical bars whose brightness was proportional to the sine of their horizontal position on the screen. These bars were very similar to the patches described in that linked article. The device was challenging to build at a low cost back in those days. Micro computers were nowhere near fast enough to generate the sinusoidal wave in real time, and memory was far too expensive to do what would be obvious today: make a pure graphics display and compute the brightness for each pixel. So I ended up with a compromise design. First, by displaying only vertical bars (and physically rotating the display for other orientations) I had the advantage of having the exact same brightness pattern on every raster line. That meant I needed only enough memory to store the brightness for a single line, and that turned out to be 1k bytes. I just used the same values in memory for every raster line. Then instead of computing the sine for every pixel in that memory, I estimated it with a linear interpolation between two points 5 degrees apart. I further reduced the computation required by using the fact that each quadrant (90 degrees) of the sine is a mirror of the others, so by computing one sine I got three more for only the cost of a few additions and subtractions. By doing all this I was able to have that device load a new set of values for the display in under a second – which sounds very slow by today's standards, but back then was quite zippy. It was a good example of the sorts of “tricks” engineers routinely resorted to back then to accommodate the wimpy processors available then.
That instrument had one more interesting little twist. To generate the raster waveform, I needed a fairly fast 8 bit D/A converter. Those were only available back then as multi-component modules, fairly large and very expensive. The state-of-the-art then for D/A converters was the ladder adder, with precision resistors in an “oven” to keep them at a constant temperature. That was all way more expense and complexity than we wanted in this instrument! A different approach was definitely needed. What I came up with was slightly heretical, but perfectly adequate for our needs. For each of the eight bits of output value I connected a FET switch driving a resistor. The resistor value for the most significant bit was 1k ohms, and for each bit of lower significance it was about 2.05 times the value of the next most significant bit. Each of these resistors was actually a simple resistor in series with a trimmer potentiometer, so I could tweak it to the right value. The other end of these resistors were connected together at the input of an op-amp buffer. The net effect was a simple analog adder. By using a multiplier of 2.05 (instead of the 2.0 you'd expect), I had a simple way of guaranteeing the output would monotonically increase as the digital input value increased. By keeping the design to a simple adder, the circuit was quite fast (though just barely within the capability of the op-amps then available). The trickiest bit of that circuit turned out to be a sample-and-hold piece that was needed in order to avoid the inevitable settling noise when the digital value was changed. This set of tricks only worked because precision was less important than monotonicity for this application, but it was fun to be able to take advantage of that. The entire D/A converter cost about $15 in parts, versus $3,500 or so for the commercial module. That was really fun!